Have you ever imagine what process that consume I/O usage on our server? I searched on on forums but I cant find definitely the answer. I still doubt about the answer. I try to find myself and make some experience. In this post, I will show some analysis how can we determine the I/O usage on our server.

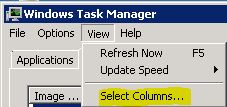
The easiest way to get a quick view into your I\O usage is to use Task Manager. I will show you how to find that information. First you need to open up Task Manager. To do this, right click the task bar and choose Start Task Manager. When you have it running, click the Processes tab. Then from the menu choose View -> Select Columns…
This will bring up the Select Process Page Columns. Scroll down to the bottom and put a check beside I/O Reads, I/O Writes, I/O Read Bytes, and I/O Write Bytes.
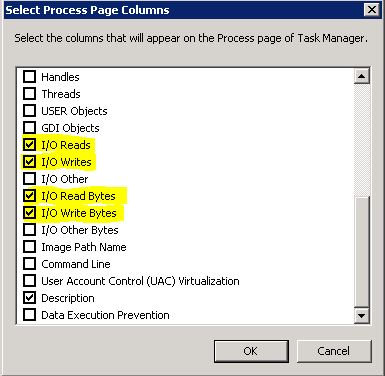
Click OK when you are finished and the columns will be added to Task Manager. You should note that the numbers listed in Task Manager are totals for each of those items since the last boot of the system.
Here is a description of the columns of the counters that were added to Task Manager above.
I/O Reads - The number of read input/output operations generated by a process, including file, network, and device I/Os. I/O Reads directed to CONSOLE (console input object) handles are not counted.
I/O Writes – The number of write input/output operations generated by a process, including file, network, and device I/Os. I/O Writes directed to CONSOLE (console input object) handles are not counted.
I/O Read Bytes – The number of bytes read in input/output operations generated by a process, including file, network, and device I/Os. I/O Read Bytes directed to CONSOLE (console input object) handles are not counted.
I/O Write Bytes – The number of bytes written in input/output operations generated by a process, including file, network, and device I/Os. I/O Write Bytes directed to CONSOLE (console input object) handles are not counted.
You can look at the new columns that are showing up in Task Manager and see the processes that have used the most I/O since the last reboot of the server. Often this is all the information you need to narrow down the top I/O usage per process.
Sometimes using Task Manager is not enough to help you narrow down the usage. Maybe you need to know what is using the I\O right now or want to paint a picture of I\O usage over the next 7 days. That is a good job for Performance Monitor. Before we look at how to add the counters to Performance Monitor, here is the mapping of the Task Manager Columns that were described above and their corresponding Performance Monitor Counters:
|
Task Manager
|
Performance Monitor
|
|
I/O Reads
|
Process\I/O Read Operations/sec
|
|
I/O Writes
|
Process\I/O Write Operations/sec
|
|
I/O Read Bytes
|
Process\I/O Read Bytes/sec
|
|
I/O Write Bytes
|
Process\I/O Write Bytes/sec
|
To start up Performance Monitor click the Start button. In the 'Search programs and files' text box enter perfmon.

Select perfmon that shows up in the results to open up Performance Monitor. Once you have it open, select Performance Monitor from the left menu so that it is highlighted. That will start allowing Performance Monitor to collect information. Next click the green Plus icon to add a counter.

When the Add Counters dialog window comes up, look for the Process object and click the plus to the right of it. That will expand the counters that are under the Process object. Based on the information that you got from Task Manager above, you can now add the appropriate counter. You will notice that when you select a counter it also wants to know if you want the _Total (the total amount from all processes for that counter), 'all instances' which will add all the instances to Performance Monitor, or a specific process. I recommend that you set the counter up for one or more specific processes that you previously found with the total highest I/O listed in Task Manager. Choosing 'all instances' will make it hard to read the results and might cause some additional resource usage on your server.
Using this information you should now be able to track down what is using the most I/O on your system.
NOTE: The step by step instructions in this article are based on Windows 2008 R2. The I/O information pertains to earlier Operating Systems as well but the actual steps might be different.