Many a time we come across a scenario where suddenly in production without any release or changes some query which was working perfectly alright till yesterday is taking too long to execute or consuming lot of resources or timing out.
Most of the times such issue are related to execution plan change (commonly referred as Plan Regression). Till yesterday the query was running fine as it was running with good cached execution plan and today a bad plan is generated and cached. Because of this bad cached plan the query which was executing perfectly alright suddenly starts misbehaving.
To identify and fix such performance problems due to the execution plan change the Query Store feature introduced in Sql Server 2016 will be very handy.
Query Store basically captures and stores the history of query execution plans and its performance data. And provides the facility to force the old execution plan if the new execution plan generated was not performing well.
What’s Interesting with SQL Query Store
The SQL Server Query Store consists of two main store parts; the Plan Store, where the execution plans information stored, and the Runtime State Store, where the execution statistics will be stored. The query execution statistics and plans are stored first in memory, and flushed to the disk after a specific interval of time. In this way, the Query Store information will not be lost when the SQL Server service is restarted, as the data is hardened to the disk. The default flush to disk configurable database option DATA_FLUSH_INTERNAL_SECONDS value is 15 minutes, this means that, the executed queries information will be written to the disk from the Query Store every 15 minutes. The smaller flush interval, the more frequent write-to-disk operations, the worst SQL performance. The Query Store data will be flushed automatically to the disk to release the memory for other processes if there is a memory pressure. For proper memory and space usage for the Query Store, the execution information is aggregated in the memory first over fixed interval of time, and then flushed to the disk in aggregated form. The max_plans_per_query option can be used to control the number of plans that will be stored for review.
SQL Server Query Store provides you with an easy way to troubleshoot query performance, where you can identify the top CPU, Memory and IO consuming queries, with full execution history for these queries in addition to find which and when the query performance regressed and fix it directly by forcing the best plan, preventing the SQL Server Query Optimizer from using the less efficient new plan. It also can be used to draw a general image about the workload of your environment, with the query text, execution plans, the number of executions and SQL Server resources utilization, which can help you in evaluating how much resources required by your SQL Server database.
When the query is executed for its first time, the query execution plan with full query properties and statistics will be stored in the Query Store internal tables. If you run the query again and the SQL Server Query Optimizer decides to recompile the query and create a new execution plan, this plan will be added to the Query Store, in addition to the old one, with the plan and query execution statistics. Query Store allows you to track the queries execution plans and performance changes, and enforce the plan that the query behaves better when you execute the query with it. When a query is compiled, the SQL Server Query Optimizer will take the latest plan in the plan cache if it is still useful, unless a PLAN HINT is used, or another plan is forced by the Query Store. In this case, the Query Optimizer will recompile the query and use that new plan. No change is required from the application side to perform that, as this is performed transparently from the users.
To start using the new Query Store feature, you need to enable it at the database level, then it will start capturing the queries execution statistics and plans automatically. The below ALTER DATABASE statement is used to enable the Query Store feature on the SQLShackDemo database , which is disabled by default, and specify the operation mode for that feature:
USE [master]
GO
ALTER DATABASE [SQLShackDemo] SET QUERY_STORE = ON
GO
ALTER DATABASE [SQLShackDemo] SET QUERY_STORE (OPERATION_MODE = READ_WRITE)
GO
You can also use the SQL Server Management Studio to enable the Query Store, from the Database Properties window below, where you can find the new Query Store tab introduced when you use the SQL Server 2016 version:
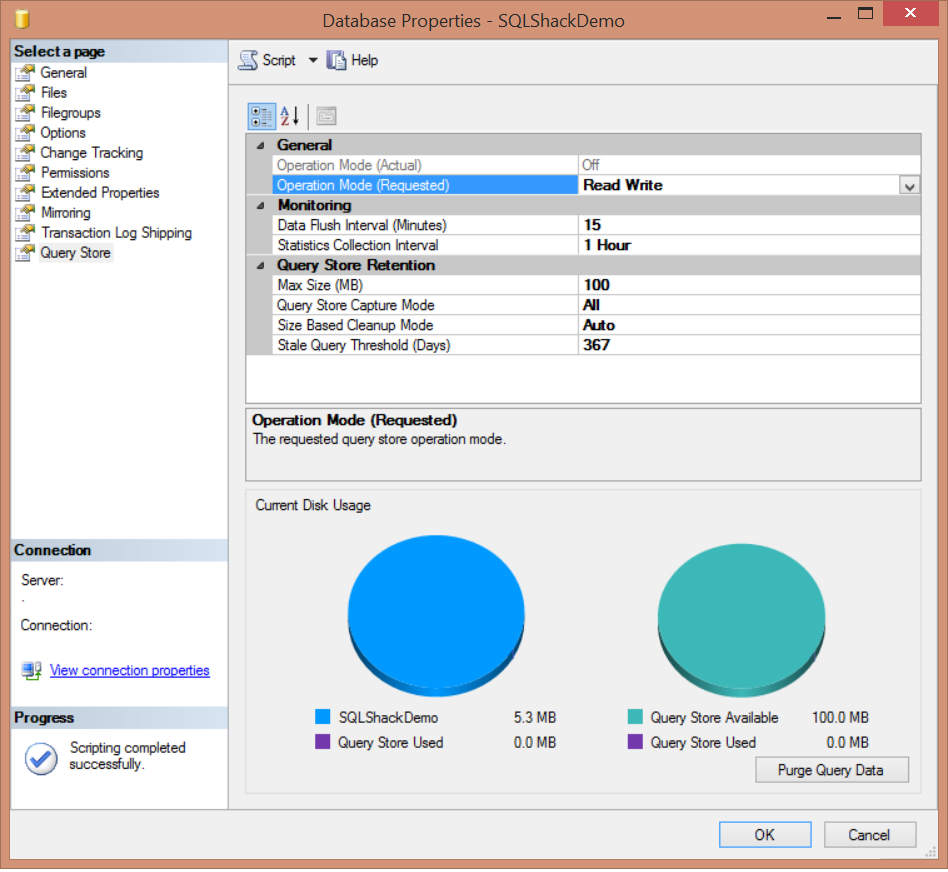
As you can see from the previous image, SQL Server Query Store can be run in two operation modes; Read-Onlymode, where you can only use the persisted statistics to analyze the queries , without capturing any new data. This occurrs when the Query Store reaches its maximum allocation space. In Read-Write mode, the Query Store will capture the execution statistics for the current workload and store it, to be used for analyzing the queries execution performance. The DATA_FLUSH_INTERVAL_SECONDS option determines how frequent the Query Store data stored in the memory will be asynchronously transferred to the disk. By default, SQL Server will write the in-memory Query Store statistics to the disk every 15 minutes, or 900 seconds. You can also flush the Query Store data manually from the memory to the disk by executing the below query:
USE SQLShackDemo
GO
EXEC sys.sp_query_store_flush_db
The maximum size of data that can be stored in the Query Store can be controlled by the MAX_STORAGE_SIZE_MB option. As mentioned previously, exceeding that limit will change the Query Store operation mode to Read-Only mode automatically. By default, the Query Store can keep up to 100 MB of query statistical data before transferring to the Read-Only operation mode. You can make sure that the Query Store will activate the cleanup process if the execution data exceeds the MAX_STORAGE_SIZE_MB value by setting the SIZE_BASED_CLEANUP_MODE to AUTO, which is the default value, or turn it OFF to stop the automatic cleanup process.
The QUERY_CAPTURE_MODE option specifies if the Query Store will capture ALL queries, or ignore the queries that are not running frequently or running on a very small time with AUTO capture mode or stop capturing any new query using the NONE capture mode. The number of days to keep the Query Store data is specified by the STALE_QUERY_THRESHOLD_DAYS parameter.
As mentioned previously in this article, query execution statistics data is aggregated in memory and later flushed to Query Store internal tables to optimize the space usage. The aggregation process is performed over a fixed time interval that is controlled by the INTERVAL_LENGTH_MINUTES parameter, which is 60 minutes by default.
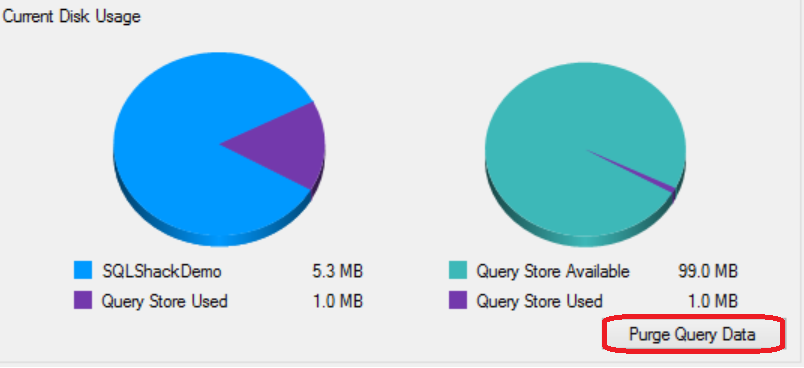
You can also find other useful information in the Query Store page under the Database Properties window, such as the Query Store disk usage in the current database and disk space used by the Query Store internal tables. This page allows you to delete or purge the Query Store data by clicking on the Purge Query Data at the right bottom part of the window:
Or use the below ALTER statement to purge the content of the Query Store:
ALTER DATABASE [SQLShackDemo] SET QUERY_STORE CLEAR
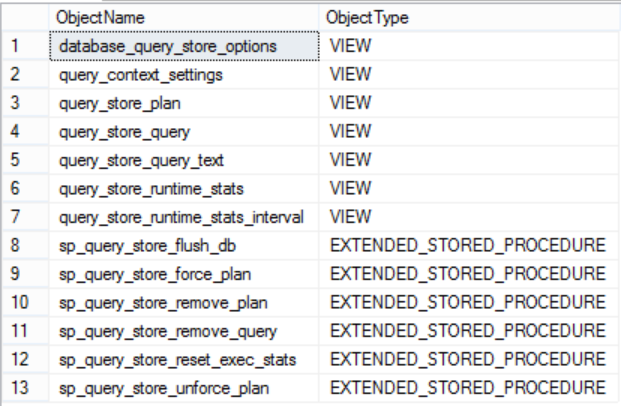
SQL Server introduced 6 new system stored procedures and 7 new system views to check the Query Store feature information and deal with it. These system objects can be listed by querying the sys.all_objects system table as below:
USE master
GO
SELECT Name as ObjectName , type_desc as ObjectType
FROM sys.all_objects
WHERE name LIKE '%query_store%'
or name= 'query_context_settings'
The result will be like:
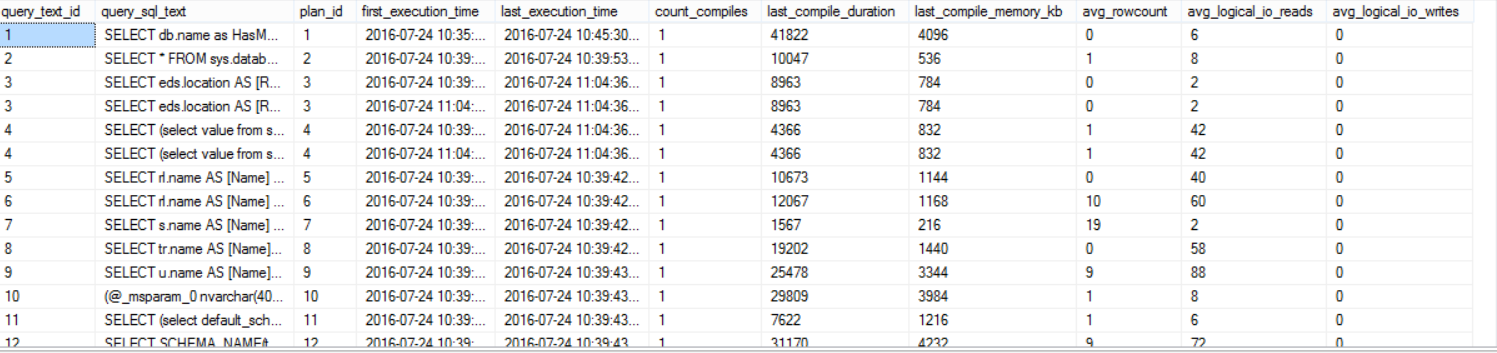
The sys.query_store_plan, sys.query_store_query, and sys.query_store_query_text system tables can be used to get the current query plans in the Query Store. To show you up-to-date statistics, the data stored in the disk and the current data in the memory will be merged together to provide toy with full image as follows:
SELECT QST.query_text_id,
QST.query_sql_text,
QSP.plan_id,
QSRS.first_execution_time,
QSQ.last_execution_time,
QSQ.count_compiles,
QSQ.last_compile_duration,
QSQ.last_compile_memory_kb,
QSRS.avg_rowcount,
QSRS.avg_logical_io_reads,
QSRS.avg_logical_io_writes
FROM sys.query_store_plan AS QSP
JOIN sys.query_store_query AS QSQ
ON QSP.query_id = QSQ.query_id
JOIN sys.query_store_query_text AS QST
ON QSQ.query_text_id = QST.query_text_id
JOIN sys.query_store_runtime_stats QSRS
ON QSP.plan_id =QSRS.plan_id
The result will be like:
The SQL Server Query Store has no direct impact on SQL Server performance, but you need to take into consideration the disk space required to store the aggregated query execution data, where the data will be stored in the Primary database filegroup and consume the configurable MAX_STORAGE_SIZE_MB disk amount as described previously. Also the Query Store capture the execution data asynchronously as it writes the data to the memory first and flush it later to the disk. Query Store avoids consuming the CPU and Memory resources in the way it uses to capture the new plans and the executions statistics.
Once the Query Store is enabled on your database, you can query the sys.database_query_store_options system object to check the Query Store settings you configured as follows:
USE SQLShackDemo
GO
SELECT actual_state_desc,
flush_interval_seconds,
interval_length_minutes,
max_storage_size_mb,
stale_query_threshold_days,
max_plans_per_query,
query_capture_mode_desc,
size_based_cleanup_mode_desc
FROM sys.database_query_store_options;
The result in our case will be like:

Refresh your database node from the Object Explorer to ensure that the new Query Store node that is added in SQL Server 2016, is enabled as below:
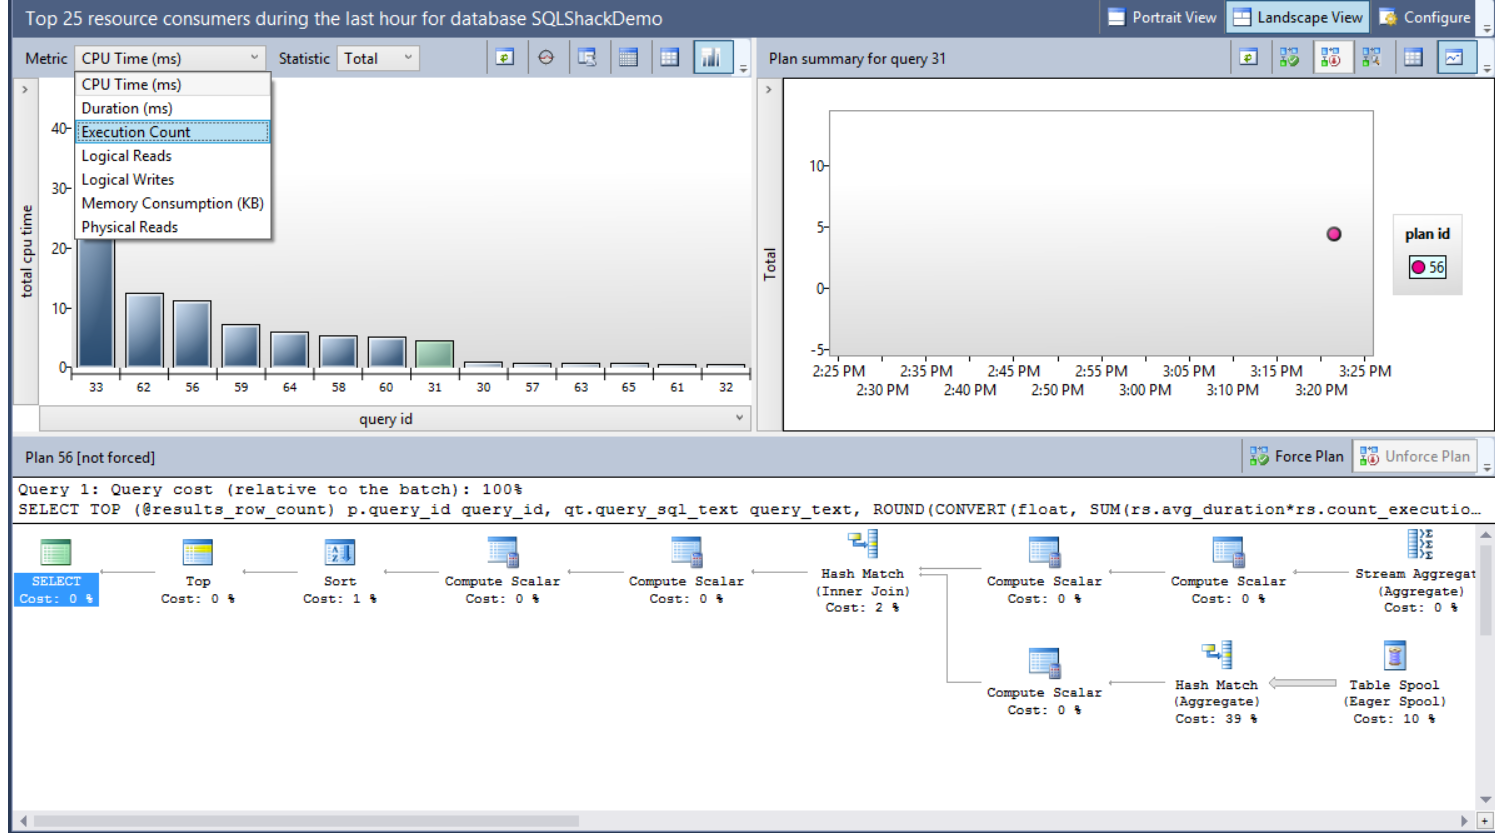
Four nodes will be displayed, from where you can check and track the changes in the queries execution statistics and performance. Choose the Regressed Queries node that will show you the queries execution plans with all related statistics:
From the previous window, you can use the Metric drop-down list to choose the criteria that will be used to compare the execution plans performance, with the Statistic drop-down list to select the aggregation function used in the comparison. You can also view the graphical plan for the queries, the query text and the available plans for the query to force the best plan if requested.
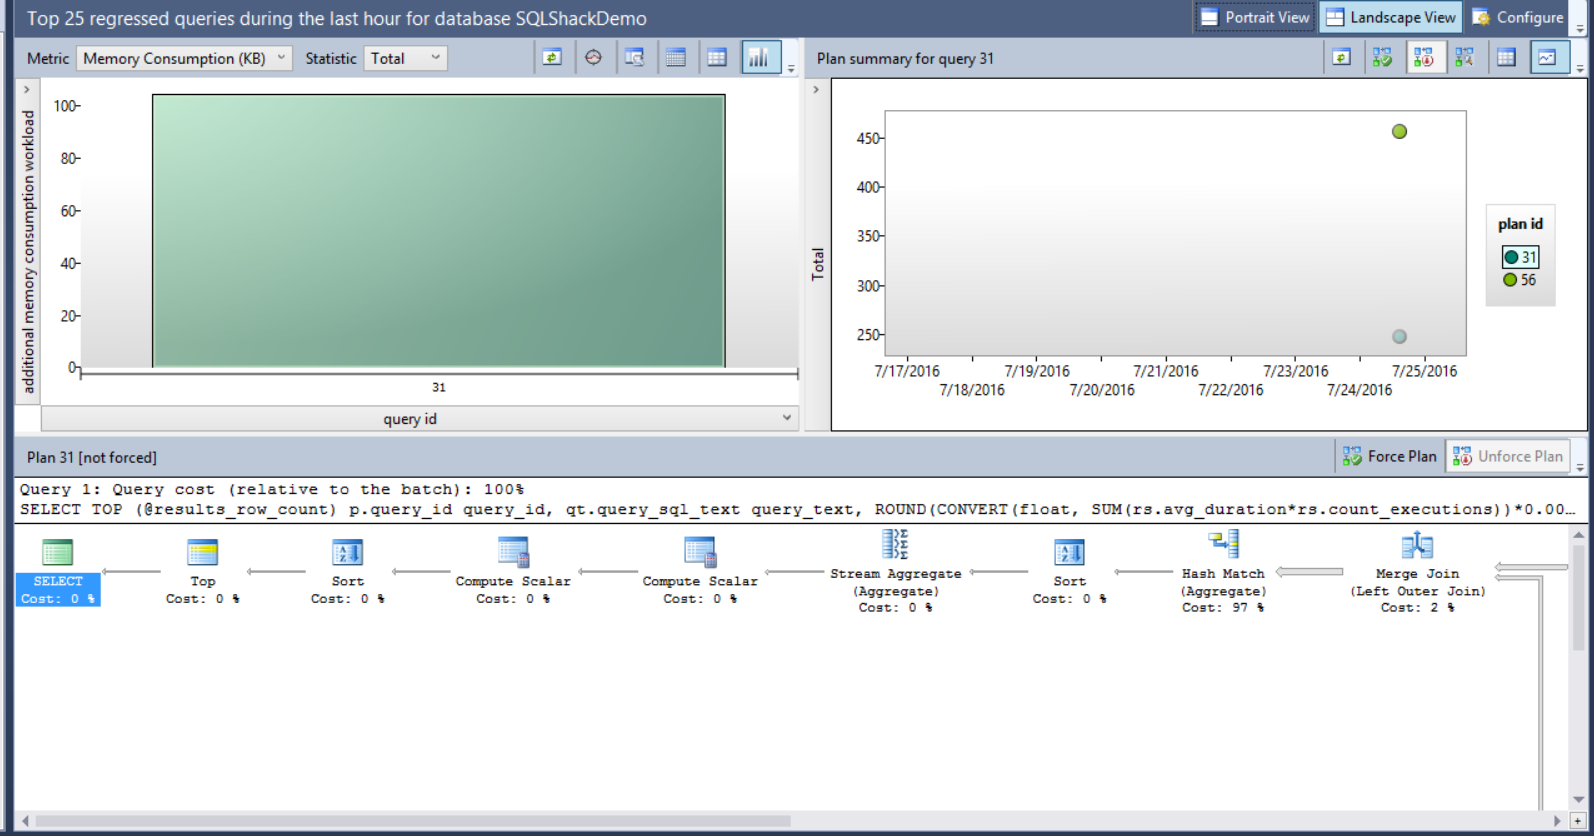
Assume that we faced a memory consumption performance issue recently with one of our queries, and we arrange to force the Query Optimizer to use the old plan. Using the Query Store feature, select the Memory Consumption (KB) metric, the query and the plan as in the below window:
<image>
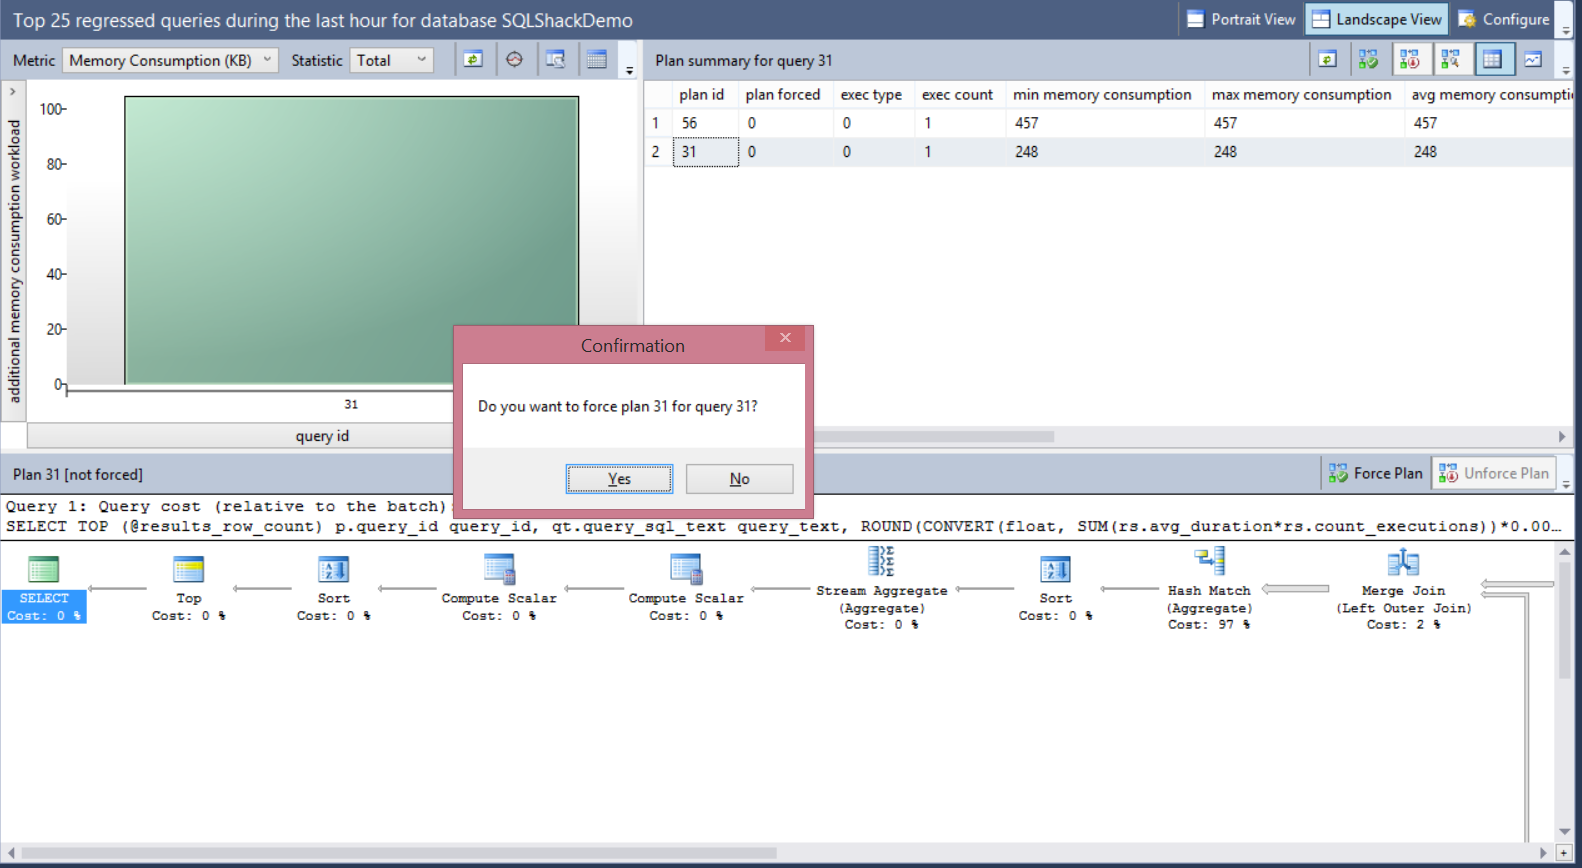
It is clear that the memory consumption for plan 56 is double the memory consumption of plan 31, so we will force the plan 31 for that query. The size of the bubbles shown in the right chart of the window depends on the total number of executions for each plan. The plans data can be displayed in grid form or as bubbles depends in the view you choose. Choose plan 31 in the previous window and click on Force Plan button.
A message will be displayed to confirm that you need to force the selected plan for that query as follows:
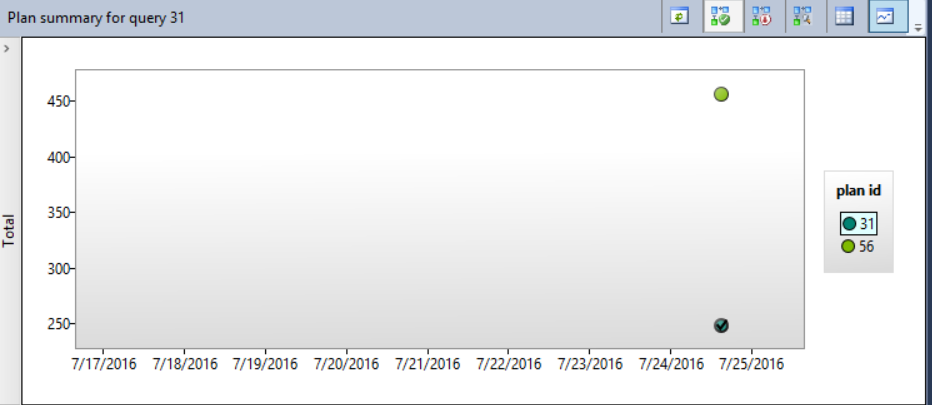
This action will force the SQL Server Query Optimizer to recompile that query in the next run using the forced plan. The selected plan will be shown with tick inside it, indicating that this plan is forced now for that query as below:
You can also use the sp_query_store_force_plan SP to enforce a specific plan for the query as follows:
EXEC sp_query_store_force_plan @query_id = 31, @plan_id = 31;
Conclusion:
The SQL Server Query Store is a nice feature introduced in SQL Server 2016, which certainly merits your time and attention, although it will take few minutes from you to configure and learn. This feature is a simple way that can be used to track performance changes and troubleshoot any degradation in the queries performance by comparing the execution plans for the same query and force the best one by overriding the one saved in the plan cache and used by the Query Optimizer. The SQL Server Query Store has no major impact on SQL Server performance due to the way that is used in capturing and saving the queries execution statistics and plans to be viewed later.